


Basic financial information
| in PLN thousand | in EURO thousand | |||
|---|---|---|---|---|
| Basic figures from separate statement of comprehensive income | For the year ended 31 December 2018 |
For the year ended 31 December 2017 |
For the year ended 31 December 2018 |
For the year ended 31 December 2017 |
| 1. Revenue from sales | 575 337 | 582 653 | 134 837 | 137 266 |
| 2. Operating profit | 63 058 | 81 580 | 14 778 | 19 219 |
| 3. Profit before tax | 90 372 | 117 908 | 21 180 | 27 778 |
| 4. Net profit | 77 036 | 101 339 | 18 054 | 23 874 |
| 5. Other comprehensive income, net of tax | (671) | (124) | (157) | (29) |
| 6. Total comprehensive income | 76 365 | 101 215 | 17 897 | 23 845 |
| Basic figures from separate statement of cash flows | ||||
| 7. Net cash flow from operating activities | 134 194 | 194 268 | 31 450 | 45 767 |
| 8. Net cash flow from investing activities | (62 759) | (21 314) | (14 708) | (5 021) |
| 9. Net cash flow from financing activities | (66 366) | (122 987) | (15 554) | (28 974) |
| Basic figures from separate statement of financial position | As at 31 December 2018 |
As at 31 December 2017 |
As at 31 December 2018 |
As at 31 December 2017 |
| 10. Non-current assets | 1 406 223 | 1 408 880 | 327 029 | 337 788 |
| 11. Current assets | 331 860 | 315 295 | 77 177 | 75 594 |
| 12. Total assets | 1 738 083 | 1 724 175 | 404 206 | 413 382 |
| 13. Non-current liabilities | 153 191 | 165 739 | 35 626 | 39 737 |
| 14. Current liabilities | 175 082 | 184 761 | 40 717 | 44 298 |
| 15. Equity | 1 409 810 | 1 373 675 | 327 863 | 329 347 |
Exchange rates of euro used for translation of selected financial data
- Statement of financial position items - average exchange rate announced by NBP as at 31 December 2018 4.3000
- Statement of comprehensive income and cash flows items - arithmetic average of average exchange rates announced by NBP as at the end of each mont of the period from 1 January to 31 December 2018 4.2669
- Statement of financial position items - average exchange rate announced by NBP as at 31 December 2017 4.1709
- Statement of comprehensive income and cash flows items - arithmetic average of average exchange rates announced by NBP as at the end of each mont of the period from 1 January to 31 December 2017 4.2447
Basic ratios
| (%) | from 1 January to 31 December 2018 | from 1 January to 31 December 2017 | Change (%) |
|---|---|---|---|
| Return on assets (ROA) | 4.43 | 5.88 | (25) |
| Return on equity (ROE) | 5.46 | 7.38 | (26) |
| Return on capital employed (ROCE) | 4.99 | 6.50 | (23) |
Net profit analysis
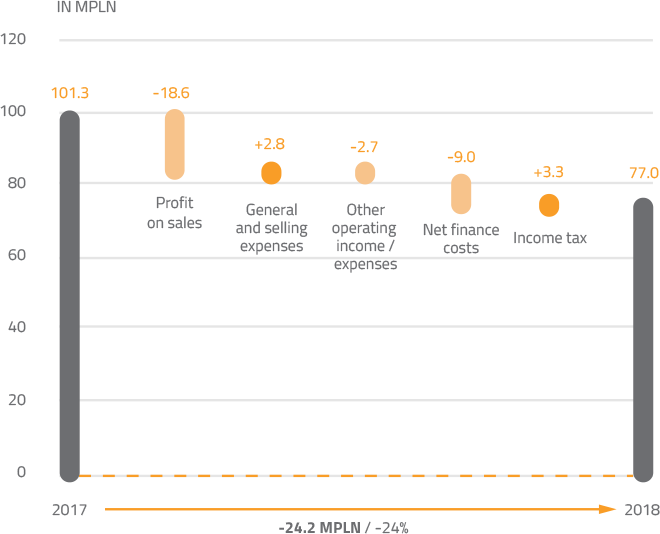
Lower net profit as compared to 2017 by 24.2 MPLN (-24%), mainly due to the following:
- -18.6 MPLN - lower profit on sales due to:
- -7.3 MPLN lower revenue from sales (mainly due to lower volume of heat sales)
- -11.3 MPLN higher cost of sales:
- -14.5 MPLN higher variable costs,
- +3.2 MPLN lower fixed costs
- +2.8 MPLN - lower general, administrative and selling expenses
- -2.7 MPLN - lower other operating expenses, including:
- -0.3 MPLN increase in provisions for landfill reclamation
- -1.1 MPLN net result of impairment charges and provisions raised and released in 2017
- -2.0 MPLN sales of assets
- +0.7 MPLN lower maintenance expenses of ESP Młoty.
- -9.0 MPLN - lower result on financial operation, i.e.:
- -10.0 MPLN lower dividend received from EC Zielona Góra S.A. (25.1 MPLN in 2018 and 35.1 MPLN in 2017)
- +1.0 MPLN: MPLN higher financial revenues, including +0.6 MPLN cash-pool interests , +0.9 MPLN the valuation of contracts for the sale of CO2 emission right, -0.5 MPLN lower interests on leasing,
- +3.3 MPLN - lower income tax.
Revenues
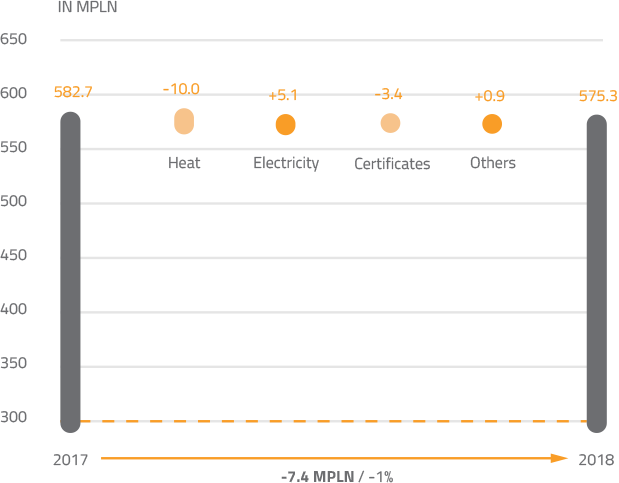
Lower revenue as compared to 2017 by 7.4 MPLN (1%), mainly due to the following:
- -10.0 MPLN - lower revenues on heat sales (decrease of heat volume by 3% with comparable prices resulting from heat tariff)
- +5.1 MPLN - higher revenues on sales of electricity, i.e. (higher sales prices of electricity by 5.0%, lower volume by ca. 2.2%)
- -3.4 MPLN - lower revenues on sales of certificates (lower volume of certificates sold)
- +0.9 MPLN - higher other revenues.
Fixed and variable costs
Fixed costs
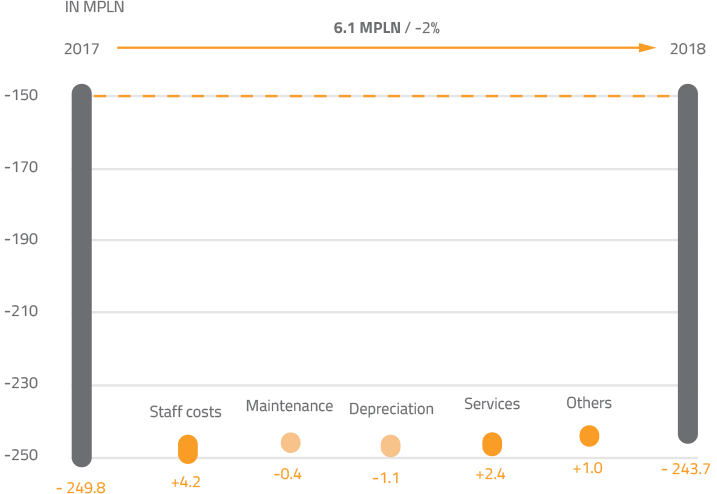
Lower fixed costs as compared to 2017 by 6.1 MPLN.
Staff costs increased by 4.2 MPLN, i.e.:
- +2.4 MPLN lower costs of remunerations including a lower level of management remuneration due to a lower number of Management Board members and different rules for remunerating them
- +1.8 MPLN level social insurance costs and other employees benefits
Maintenance costs increased by 0.4 MPLN: an effect of a wider scope of maintenance in 2017.
Depreciation increased by 1.1 MPLN due to the purchase of new fixed assets.
Variable costs
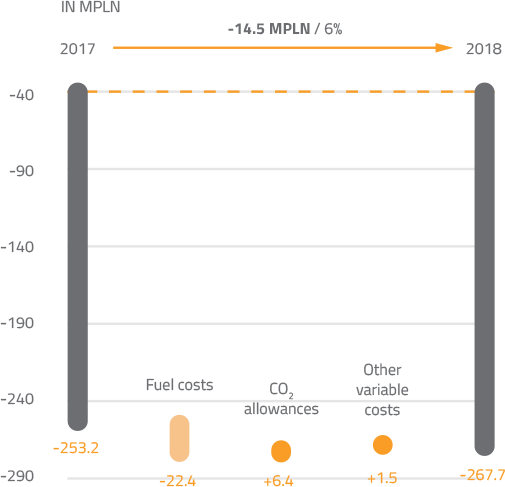
Higher variable costs as compared to 2017 by 14.5 MPLN..
Fuel costs increased by 22.4 MPLN, i.e.:
-28.6 MPLN lower costs of coal purchase due to the following:
- -7.9 MPLN higher volume of coal consumption (17 053 TJ in 2018, 16 334 TJ in 2017)
- -20.7 MPLN lower coal price by 12%,
+7.1 MPLN lower biomass costs due to the following:
- +8.5 MPLN lower volume of biomass consumption (349 TJ in 2018, 696 TJ in 2017)
- -1.4 MPLN higher biomass price by 6%
-1.0 MPLN higher gas costs, higher volume of gas consumption,
+0.1 MPLN lower cost of liquid fuels.
Costs of the shortage and purchase of CO2 allowances decreased by 6.4 MPLN. The decrease in costs was the result of two factors: a lower limit of free allowances than in 2017 by 9% and a lower purchase price of allowances (down by 9%) thanks to forward transactions concluded in earlier periods when prices were lower in comparison to current market prices.
Free CO2 allowances received in 2018 covered 30% of the CO2 emissions, while CO2 allowances received in 2017 covered 20% of emissions.
Other variable costs increased by 1.5 MPLN, i.e.:
- +1.7 MPLN decrease in the cost of certificates redemption
- +1.6 MPLN decrease in other costs related to energy purchase and balance market
- -0.6 MPLN increase in environmental protection costs
- -1.2 MPLN increase in the cost of other services.
Separate statement of cash flows analysis

