


Basic figures from consolidated financial statement
| in PLN thousand | in EURO thousand | |||
|---|---|---|---|---|
| Basic figures from consolidated statement of comprehensive income | For the year ended 31 December 2018 |
For the year ended 31 December 2017 |
For the year ended 31 December 2018 |
For the year ended 31 December 2017 |
| 1. Revenue from sales | 960 622 | 1 014 204 | 225 133 | 238 934 |
| 2. Cost of sales | (823 871) | (817 320) | (193 084) | (192 551) |
| 3. Revenue/(costs) of compensation for stranded costs | (119 825) | (27 180) | (28 082) | (6 403) |
| 4. Operating profit | 11 826 | 165 114 | 2 772 | 38 899 |
| 5. Profit before tax | 15 110 | 164 544 | 3 541 | 38 765 |
| 6. Net profit | 11 270 | 132 275 | 2 641 | 31 162 |
| 7. Net profit for the period attributable to ordinary shareholders | 11 929 | 131 225 | 2 795 | 30 915 |
| 8. Net profit for the period attributable to non- controlling interests | (659) | 1 050 | (154) | 247 |
| 9. Basic earnings per share (in PLN/EUR) | 0.80 | 8.81 | 0.19 | 2.07 |
| 10. Other comprehensive income, net of tax | (671) | (124) | (157) | (29) |
| 11. Total comprehensive income | 10 599 | 132 151 | 2 484 | 31 133 |
| Basic figures from consolidated statement of cash flows | ||||
| 12. Net cash flow from operating activities | 191 244 | 330 881 | 44 820 | 77 952 |
| 13. Net cash flow from investing activities | (124 306) | (77 548) | (29 133) | (18 269) |
| 14. Net cash flow from financing activities | (64 873) | (117 449) | (15 204) | (27 670) |
| Basic figures from consolidated statement of financial position | As at 31 December 2018 |
As at 31 December 2017 |
As at 31 December 2018 |
As at 31 December 2017 |
| 15. Non-current assets | 1 735 771 | 1 715 919 | 403 668 | 411 402 |
| 16. Current assets | 649 506 | 601 193 | 151 048 | 144 140 |
| 17. Total assets | 2 385 277 | 2 317 112 | 554 716 | 555 542 |
| 18. Non-current liabilities | 666 629 | 560 281 | 155 030 | 134 331 |
| 19. Current liabilities | 252 099 | 260 244 | 58 628 | 62 395 |
| 20. Equity attributable to ordinary shareholders | 1 463 453 | 1 492 425 | 340 338 | 357 818 |
| 21. Equity attributable to non- controlling interests | 3 096 | 4 162 | 720 | 998 |
| 22. Equity | 1 466 549 | 1 496 587 | 341 058 | 358 816 |
| 23. Number of shares (in thousands) | 14 900 | 14 900 | 14 900 | 14 900 |
| 24. Book value and diluted book value per share (in PLN/EUR) | 98.43 | 100.44 | 22.89 | 24.08 |
II. Exchange rates of euro used for translation of selected financial data
- Statement of financial position items - average exchange rate announced by NBP as at 31 December 2018 4.3000
- Statement of comprehensive income and cash flows items - arithmetic average of average exchange rates announced by NBP as at the end of each mont of the period from 1 January to 31 December 2018 4.2669
- Statement of financial position items - average exchange rate announced by NBP as at 31 December 2017 4.1709
- Statement of comprehensive income and cash flows items - arithmetic average of average exchange rates announced by NBP as at the end of each mont of the period from 1 January to 31 December 2017 4.2447

2. Basic ratios
| (%) | from 1 January to 31 December 2018 | from 1 January to 31 December 2017 | Change (%) |
|---|---|---|---|
| Return on assets (ROA) | 0.47 | 5.71 | (92) |
| Return on equity (ROE) | 0.77 | 8.84 | (91) |
| Return on capital employed (ROCE) | 0.79 | 10.68 | (93) |
Analysis of consolidated financial statement
Consolidated financial statement of Capital Group KOGENERACJA S.A. in 2018 [in MPLN]
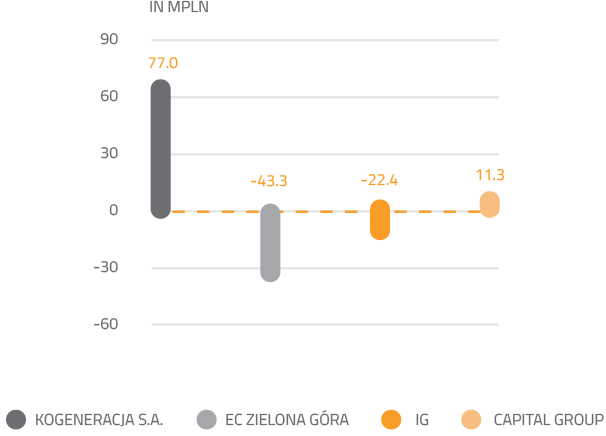
Elimination of intragroup transactions (IG) on the amount mainly refers to the dividend payment by EC Zielona Góra S.A. (-25.1 MPLN) and other intragroup transactions (+2.7 MPLN).
Analysis of consolidated net profit 2018 vs. 2017
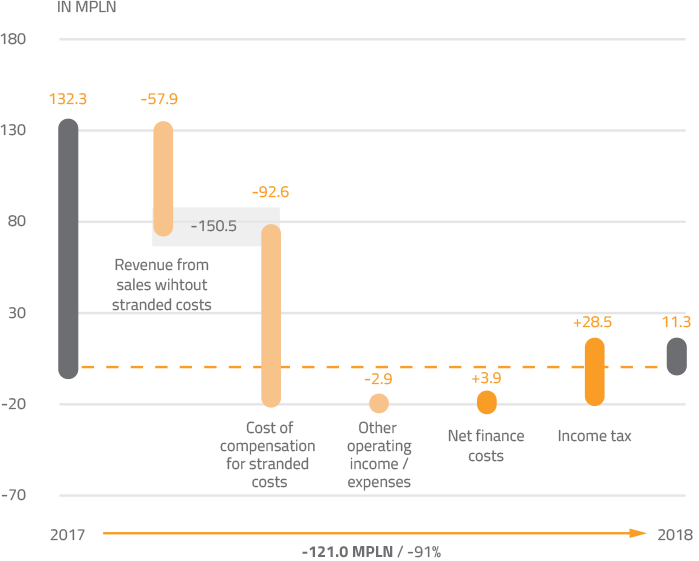
Lower net profit as compared to 2017 by 121 MPLN (-91%), mainly due to the following:
- -57.9 MPLN - lower profit on sales:
- -53.6 MPLN lower revenue on sales (mainly due to lack of revenues from gas compensation in EC Zielona Góra, a decrease in the volume of heat sales in both units and lower revenues from certificates)
- -6.6 MPLN higher cost of sales
- +2.3 MPLN lower general, administrative and selling expenses.
- -92.6 MPLN - the increase in stranded costs is the result of a 25% increase in forecast electricity price paths for 2019–2024
- -2.9 MPLN - ower other operating income, including:
- -0.3 MPLN increase in provisions for landfill reclamation
- -1.1 MPLN net result of impairment charges and provisions raised and released in 2017
- -2.0 MPLN assets sales, R2 switching station, one-off event in 2017
- +0.7 MPLN lower maintenance expenses of ESP Młoty
- -0.3 MPLN higher other operating expenses.
- +3.9 MPLN - higher net finance revenues: higher finance income +2.6 MPLN; reduced finance costs + 1.3 MPLN, i.e.:
- +2.0 MPLN higher financial revenues (interests of cash-pool)
- +1.2 MPLN CO2 emission allowances valuation of forward contracts
- +1.7 MPLN financial instruments value update
- -0.2 MPLN interests on leasing
- -0.8 MPLN higher discount on stranded costs
- +28.5 MPLN - lower income tax
Consolidated revenues
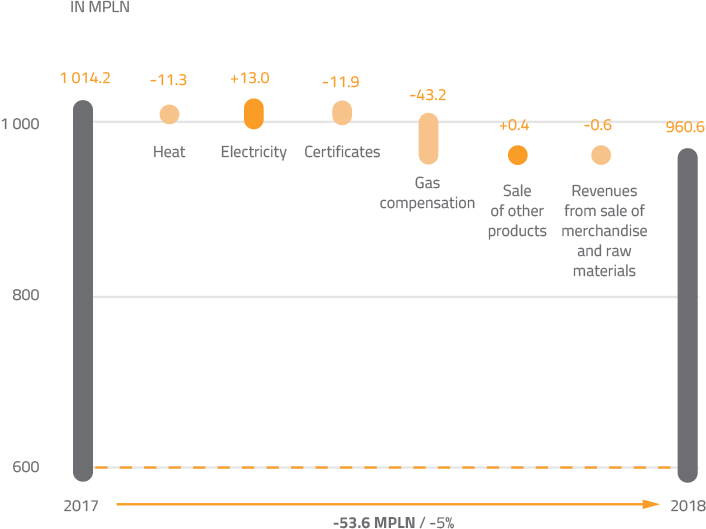
Lower revenue from sales as compared to 2017 by 53.6 MPLN (-5%), mainly due to the following:
- -11.3 MPLN lower revenues on heat sales: -10.0 MPLN in KOGENERACJA S.A., -1.3
MPLN in EC Zielona Góra S.A.
Wolumen sprzedaży: spadek o 3% w KOGENERACJI S.A. i o 2% w EC Zielona Góra S.A.
Volume: 3% decrease in KOGENERACJA S.A., 2% decrease in EC Zielona Góra S.A. Price: positive effect from average heat prices.
- +13.0 MPLN – higher revenues on electricity sales:
- +7.9 MPLN – in EC Zielona Góra S.A. higher electricity sales prices, lower sales volume by 2%,
- +5.1 MPLN - in the Dominant Company higher revenues form electricity sales KOGENERACJA S.A. (higher electricity sales prices by ca. 5%, lower sales volume by 2%)
- -11.9 MPLN lower revenues on sales of certificates: -8.5 MPLN lower revenues on sales of yellow certificates in EC Zielona Góra S.A. and -7.7 MPLN lower revenues on sales of certificates in KOGENERACJA S.A.
- -42.8 MPLN lower other revenues from sales, incl. lack of revenues from gas compensation -43.2 MPLN in EC Zielona Góra S.A.
- -0.6 MPLN lower revenues from the sale of merchandise – lower resale of electricity by EC Zielona Góra S.A.
Consolidated fixed and variable costs
Fixed costs
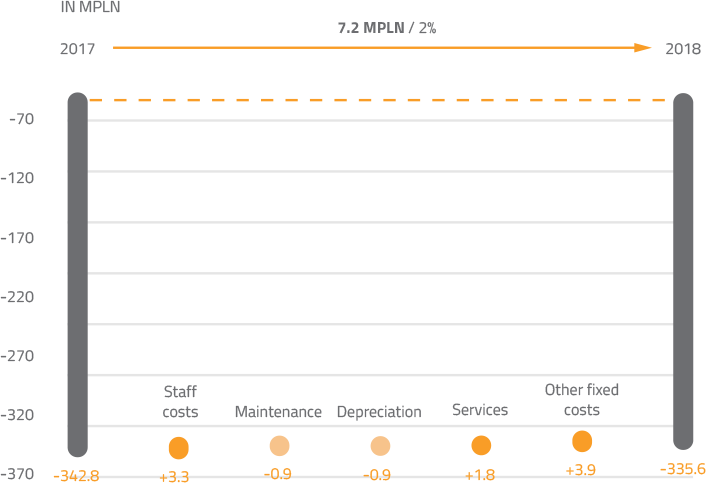
Lower fixed costs as compared to 2017 by 7.2 MPLN (2%).
Staff costs decreased by 3.3 MPLN, i.e.:+4.2 MPLN lower staff costs in KOGENERACJA S.A.; ‑0.9 MPLN higher staff costs in EC Zielona Góra S.A.
Maintenance costs increased by 0.9 MPLN – increase in Parent Company KOGENERACJA S.A. by 0.4 MPLN, increase in EC Zielona Góra S.A. by 0.5 MPLN.
Depreciation increased by 0.9 MPLN, i.e.: higher depreciation costs by 1.1 MPLN in Dominant Company KOGENERACJA due to the purchase of new fixed assets and +0.2 MPLN decrease in EC Zielona Góra S.A.
Cost of services decreased by 1.8 MPLN and other fixed costs decreased by 3.9 MPLN.
Variable costs
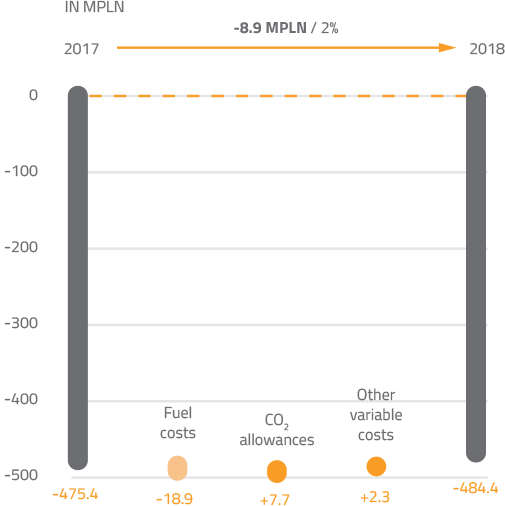
Higher variable costs as compared to 2017 by 8.9 MPLN (5%).
FresteatmentsFuel costs decreased by 18.9 MPLN, i.e.:
- -28.6 MPLN; lower costs of coal purchase due to the following:
- -7.9 MPLN - higher volume of coal consumption (17 035 TJ in 2018, 16 334 TJ in 2017)
- -20.7 MPLN - ower coal price by 12%
- +7.1 MPLN; lower biomass costs due to the following:
- +8.5 MPLN - lower volume of biomass consumption (349 TJ in 2018, 696 TJ in 2017)
- -1.4 MPLN - higher biomass price by 6%
- +2.5 MPLN; +3.5 MPLN lower gas volume consumption in EC Zielona Góra S.A., -1.0 MPLN higher gas costs, higher gas volume consumption in KOGENERACJA
- +0.1 MPLN; lower cost of liquid fuels.
Costs of the shortage and purchase of CO2 allowances decreased by 7.7 MPLN (+6.4 MPLN in KOGENERACJA S.A., +1.3 MPLN in EC Zielona Góra S.A.) The decrease in costs was the result of two factors: a lower limit of free allowances than in 2017 by 9% in Dominant Company and 14% in EC Zielona Góra S.A. and a lower purchase price of allowances thanks to forward transactions concluded in earlier periods when prices were lower in comparison to current market prices.
Other variable costs increased by 2.3 MPLN, due to electricity market activity.
Consolidated statement of cash flows


